
Recently we had “All path down issue” in one of our host and I was looking to find how many events and how long this issue was there in host and identified the below steps in the Splunk in which we can highlight the key word to find the list.We can easily get the details from the ESXi but I felt below steps will be useful for the other use cases.
Make sure we have the Add-on for VMware https://splunkbase.splunk.com/app/3215/ in splunk which is no cost and it will install the VMware sourcetype parsers.
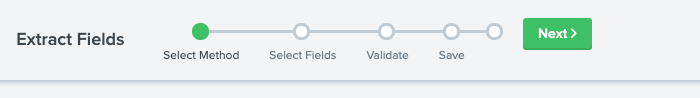
1. Click on Event Action > Extract Fields to start the wizard

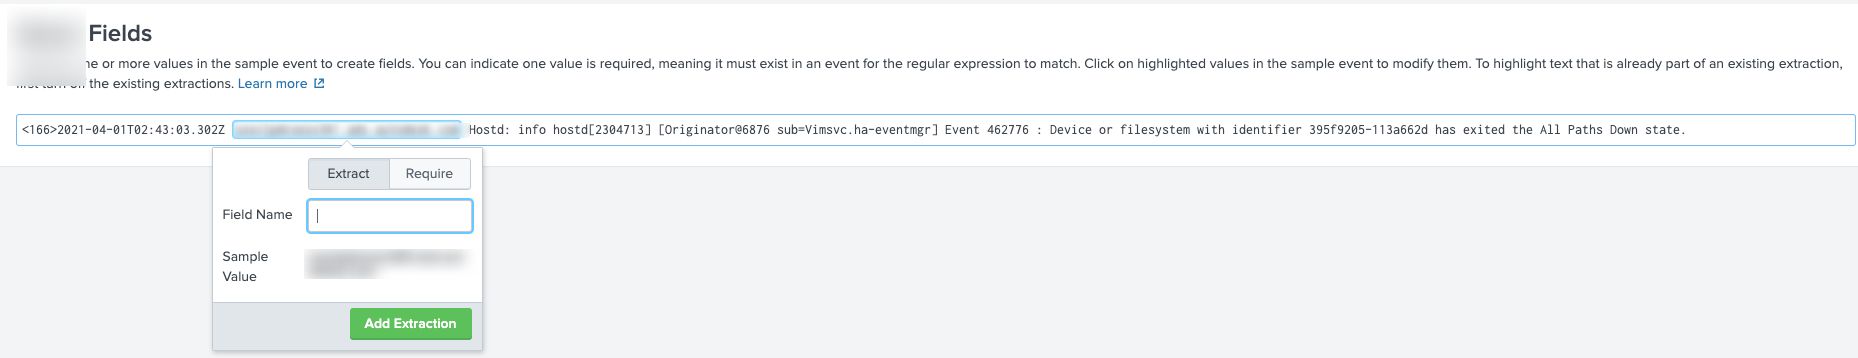
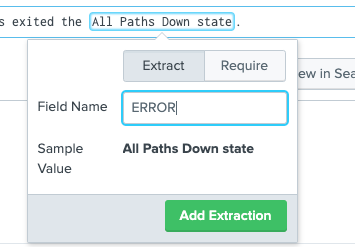
2. Select Regular Expression > highlight to select a value > name the field > continue on to validation and complete the wizard.
When you click the events it will show all the events regarding the word you highlighted .

Useful Links:
https://splunkbase.splunk.com/app/3975/

